AI Dashboard Builder — Self-Service Platform for No-Code Visual Analytics
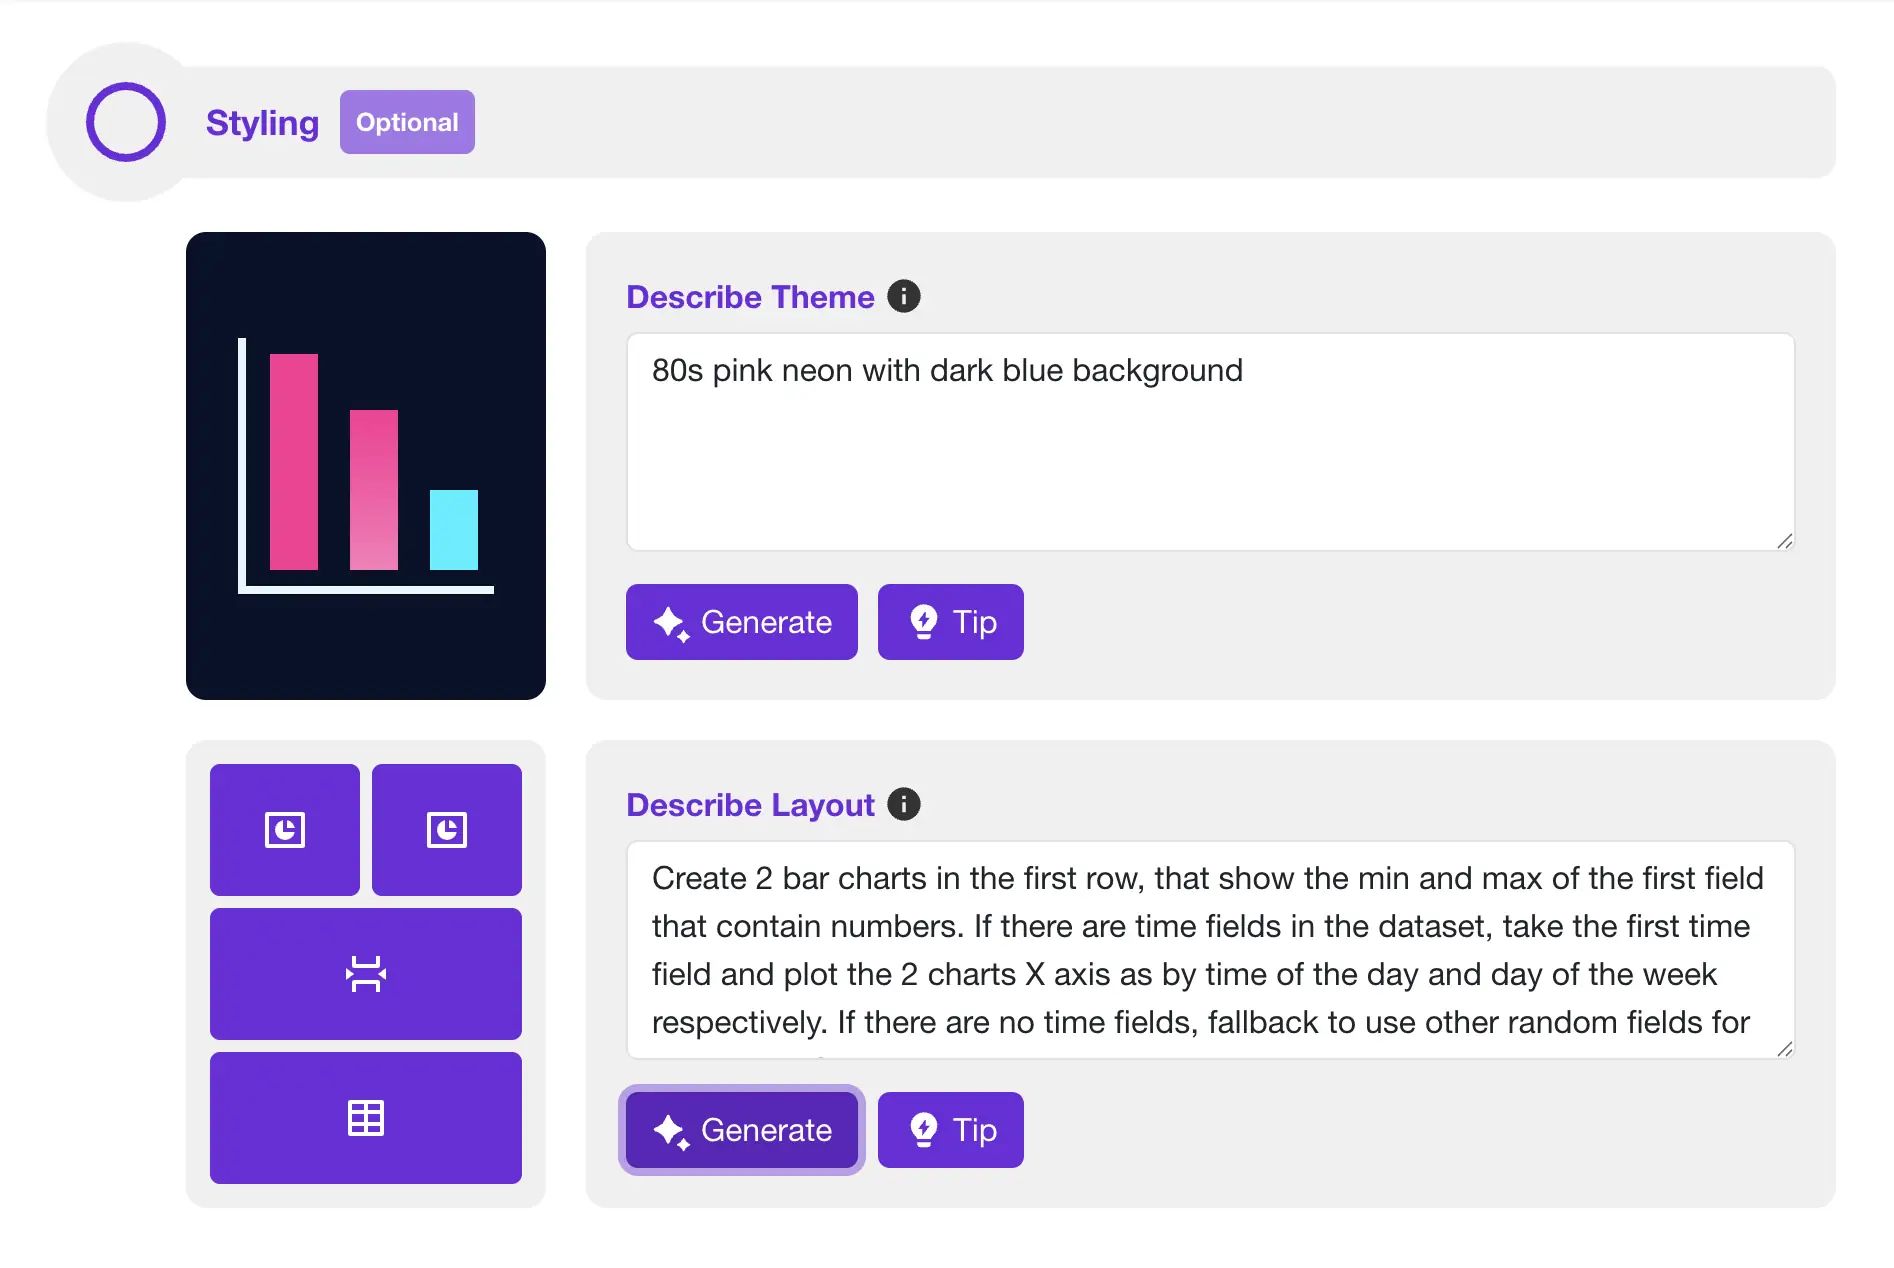
Sprucely.io's AI assistants help you automatically generate spot-on dashboard layouts and complex chart setups according to your input with an assisted flow that helps ensure you always get the data you want, presented the way you want.
Sprucely.io even excels in automatically generating dashboards with more advanced features, such as breaking down data by time seasonality.

Watch the Introduction Video
You can now create self-serve dashboards easily with just a few quick steps! In this 1.5 minute introduction feature, you will learn how to use Sprucely.io to generate interactive dashboards in seconds, not hours!
Data Turned Clarity
Sprucely.io is a fresh approach in combining real-time data streams, data sanitation and extraction, hybrid cloud data management, insights generation and presentation. It's a visual analytics as a service that automates the entire process of converting an isolated source of large data, into deeper insights and visual representations of the data. It’s not just data at your fingertips; it automatically arranges and presents itself so that you can directly gain insights that impact your business.
So how do you create effective interactive dashboards? Essentially, you need the right data extracted and highlighted for the audience to enable fast and accurate decision making. Secondly, you want to be able to drill down on data to detect patterns and extract other significant findings from the data to understand the details even better. A powerful interactive dashboard software like Sprucely.io provides these capabilities.
It's all about presentation. Sprucely.io seamlessly combines the data and insights pipeline with a built-in dashboard editor - this allows you to quickly customize the layout and theme, for example when you want to incorporate your branding and design language.
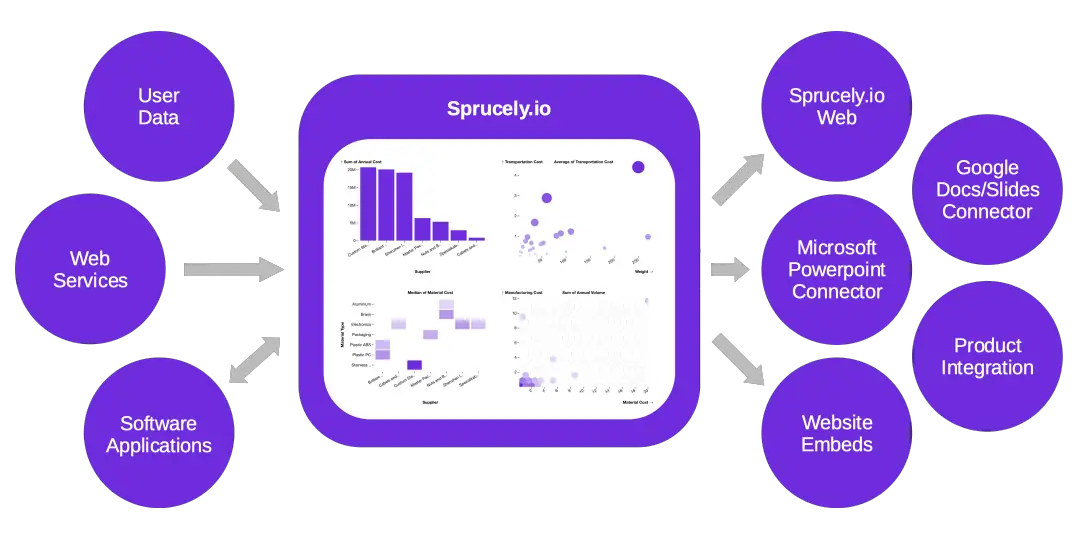
The combined result? Data-driven interactive dashboards that can be shared through the Web, or embedded directly into documents, presentations or even websites. Generated in seconds.
Hybrid Cloud Platform — Deploy in the Cloud or On-premise
Built ground up with modern web technologies, Sprucely.io can be used to share dashboards both in the Cloud and On-premise - all in one unified solution. The flexibility of the Sprucely.io platform gives you the power to define how different sets of data and dashboards shall be managed from a data confidentiality perspective. Our Cloud services have United States data residency.
By encapsulating the entire data pipeline into a unique analytics as a service offering, it abstracts away all the complexity you would otherwise need to deal with related to infrastructure, hosting, and data management, among others. You can focus on the things that matter - getting key insights and decision intelligence out of your data to help drive the business forward.
While your On-premise dashboard and dataset is accessed through the Sprucely.io website, the On-premise Connector ensures that your confidential data flows exclusively between your browser and the On-premise data storage.
This ensures data always remains within your Enterprise network.
Fair and Transparent Pricing
A fixed fee per month or year, with no limitations on usage. We don't charge additionally for viewers, which means you can easily share your dashboards with others. No obscure infrastructure and platform usage costs that cannot be calculated upfront. Cancel or upgrade/downgrade your subscription at any time based on your needs.
This is our fair offering to provide you with analytics as a service and our interactive dashboard software. You can start by registering for the Free plan that comes without any time limit restrictions, and upgrade to our advanced dashboard features when you require it.
The way it should be!

Key Features and Benefits of Interactive Dashboard Software
Analytics as a service is a cloud-based solution that provides businesses with the ability to access, analyze, and interpret large volumes of data through scalable and flexible platforms, enabling them to make informed decisions and gain competitive advantages without the need for significant investments in infrastructure or specialized personnel.
Analytics as a service is enabled via Sprucely.io's interactive dashboard software that enables you to quickly integrate data into meaningful visual reports that you can deploy or share according to your needs. If you are getting started with creating dashboards, a simple to use dashboard software providing interactive dashboards such as Sprucely.io is essential. You will be up and running in no time.
Sprucely.io works as a complete data pipeline, where most of the steps are or can be made fully automatic. In cases where the user prefers more control of the data generation, although potentially fully autonomous, Sprucely.io allows for the user to provide inputs to control the data pipeline flow, for optimal results.
This is particularly powerful for the automated dashboard key metrics generation, where the user can provide contextual cues to the Sprucely.io engine to tune the focus of which data is considered important. Tailored analytics as a service. A key benefit of this flow is that it enables you to create interactive dashboards and insights from raw data in as little as 30 seconds, while retaining the power to customize the output specifically to your intent.
The core parts of the data pipeline include automated sanitation of data, automated detection of suitable data regions to import, and automated dashboard layout and chart generation with the ability to input contextual priorities to the dashboarding engine.
Key features and benefits:
- Interactive dashboard software with integration options enabling autonomous analytics as a service
- Automated data format detection
- Automated data region detection
- Automated data sanitation
- Automated dashboard layout generation
- Automated dashboard key metrics and charts generation
- Visual dashboard editor for easy customization of dashboard
- Visual chart selector for easy selection of data and insight representations
- Styles and theme support
- Microsoft PowerPoint connector for integration
- Google Docs connector for integration
- Google Slides connector for integration
