17
Dec 2024

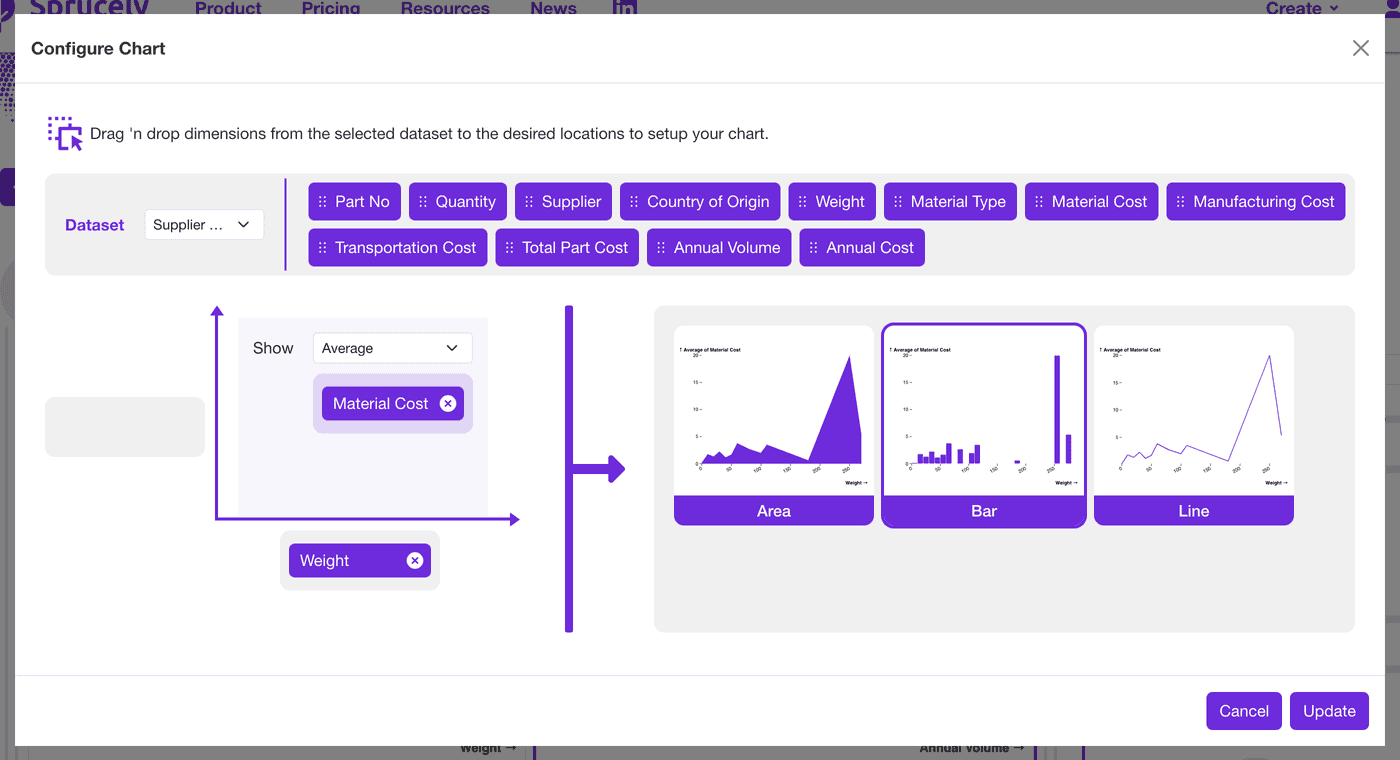
We are pleased to announece our new intuitive chart wizard that simplies the process of setting up your charts in Sprucely.io!
The wizard uses a simple drag 'n drop mechanism to allow you to pull different data dimensions to the chart axis of choice, and to configure how the data should be aggregated. Based on the desired inputs, the wizard will automatically recommend suitable chart types that support this specific set of data and settings.
The wizard replaces the old chart configuration and is now directly accessible as a chart action when hovering with the mouse over a chart, or through the properties panel in the dashboard editor when selecting a chart.